
Solar PV Generation Estimation: PVGIS-5 (Beta Release)
- Feb 1, 2018
- 5 min read

The EU, through the European Commission, operate a science and knowledge service called the 'Joint Research Centre' (JRC) which has a brief to research & provide independent evidence to support EU policies.
Hidden amongst plenty of graphical information is a particularly useful multilingual 'free to use' online tool, widely known as 'PVGIS' (PhotoVoltaic Graphical Information System), which is extensively used by owners of Solar PV systems to provide location and orientation specific monthly & annual estimates of electricity generation (kWh) for any given sized stand-alone (off-grid) or grid connected PV systems. In addition to Europe, the the current full system release (PVGIS-4) also provides details for Africa and Asia.
PVGIS-5 Beta Release
The JRC have recently opened-up access to the release candidate for the latest version PVGIS (PVGIS-5) for users to trial and provide feedback, however, there is no current plan to sunset the highly successful PVGIS-4, therefore it's likely that both releases will run in parallel for some time. Currently, version 5 is available in English, French, Italian and Spanish.
In addition to maintaining availability of the climate model dataset (CMSAF) which is the mainstay of version 4 and widely used by European based owners of Solar PV systems, PVGIS version 5 incorporates improvements to move towards global coverage using a single solar radiation dataset, SARAH. This currently incorporates data for Europe, Africa, a large proportion of Asia & parts of South America allowing estimates of solar radiation and PV performance on a standardised basis across these areas. Version 5 also incorporates datasets to extend the ability to create PV generation estimates across the majority of North & South America (PVGIS-NSRDB) as well as high latitude locations in Europe and parts of Greenland using PVGIS-ERA5 data. Obviously, the incorporation of these datasets is an attempt to provide a single-stop global solution prior to having a single dataset. Unfortunately, the dataset used in older versions of PVGIS (pre v4) which is normally referred to as PVGIS-Classic has been discontinued in version 5.
The accuracy and resolution of generation estimates has been improved within Europe through analysing historic data over an extended time span and introducing into the data model the ability to account for the cooling effect of historical average wind speeds on PV panel temperatures, and therefore performance. The latest model also attempts to better estimate the effect of the distribution of light wavelengths throughout the year so as to match the performance properties of photovoltaic panels.
PVGIS5 - New feature TMY
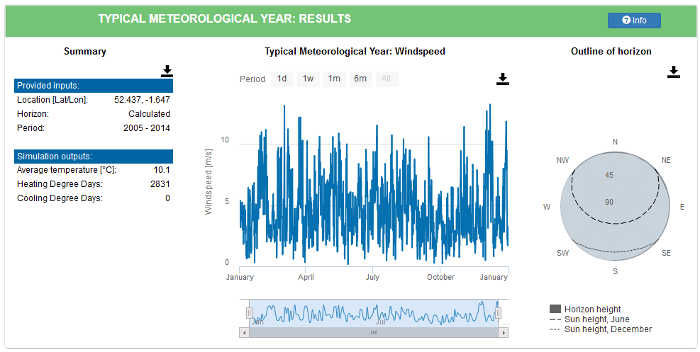
A further feature introduced in PVGIS-5 is the ability to analyse & visualise model data (wind-speed, direction, humidity, irradiance etc) which applies at a specified location for a range of Typical Meteorological Years (TMY), currently grouped into 10 year rolling periods ending 2014,15&16. In theory this is useful for architectural modelling of building efficiencies, however, it may also be a interesting tool for those interested in siting microgeneration scale wind turbines.
PVGIS5 : TMY Example - Wind Speed; Meriden, UK
PVGIS5: Maps
Version 5 of PVGIS incorporates the ability to create PDF and PNG format maps detailing regional and country specific solar PV resource potential. This functionality is more related to presentation creation and is unlikely to be of interest to the vast majority of system users.
Comparison PVGIS4 vs PVGIS5
User Interface
PVGIS4 : Variables Input Example - Meriden, UK

PVGIS5 : Variables Input Example - Meriden, UK

Generation Estimate
PVGIS4 Generation Estimate: Example - Meriden, UK

Many owners of solar pv monitor their own system's monthly and annual performance, effectively using these figures as a 'target' based on averaged expectations.
For the variables entered for the system based in Meriden as per the example screen, the total annual estimate for generation would be 3560kWh, which averages to 9.75kWh/day. Each month also has an estimated total, in this example 460kWh of electricity is expected to be generated in June, averaging 15.3kWh/day June's, which when compared to 101kWh in December (3.24kWh/day) provides an indication of the particularly wide seasonal variability of generation which is applicable to systems located within the UK.
PVGIS5 Generation Estimate (Screen): Example - Meriden, UK

Selecting 'Visualise Results' creates charted information which can be viewed in either generation or irradiation format. Hovering the cursor over a charted element displays the data value represented on the chart. In the example above, the generation for a south facing 4kWp array on a 35° slope located in Meriden, UK is estimated to be 491kWh.
PVGIS5 Generation Estimate (PDF): Example - Meriden, UK

Selecting the option to create a PDF format report produces output in the format provided in the example provided here.
The benefit of choosing this option is that a full report detailing monthly estimated irradiation & generation in charted format as well as generation in tabular form for a specific site is produced in a single page format.
This seems to be the most user friendly form of information presentation and is therefore the format which will be of most use to PV owners for creating target data.
Dataset Comparison
Using PVGIS-4 within the UK, the majority of users employed the CMSAF dataset to create location specific target generation estimates, however, with the changes available within version 5 data modelling to increase accuracy, it must be appreciated that there may be significant changes to target results achieved even is utilising the same irradiation data.
Below is a charted representation of variations in target generation for an example 4kWp (Orientation: South / Pitch: 30°) located in Meriden, UK showing all PVGIS-5 data sets which are available for that location as well as a PVGIS4-CMSAF baseline.

As can be seen, a considerable uplift in estimated generation exists resulting in the following annual change in generation against a PVGIS4-CMSAF target of 3558kWh (889.5kWh/kWp)
PVGIS5-CMSAF : +12.7%
PVGIS5-SARAH : +7.6%
PVGIS5-ERA5 : +12.8%
PVGIS5-COSMO : +6.6%
Accuracy
So, to the big question - Is PVGIS-5 accurate?. Well, of course that's a function of both the model and the particular dataset used relative to individual locations, however, in our particular case, taking the system's total generation since install against the PVGIS5-CMSAF dataset the discrepancy is 1.4% (high) before making allowance for minor winter shading, which looks remarkably good compared to the level of underestimation apparent on all previous model estimates.
At some time I'll look to apply the horizon file and age related panel degradation then re-assess, but for starters I'd certainly consider the result to be far more representative of real-world system performance.
Conclusion
Unlike the majority of changes to such tools, the move from PVGIS-4 to version 5 provides far more than the usual facelift to the user interface, it addresses long-standing issues (cooling & irradiance spectrum) which have resulted in considerable processing inaccuracies in earlier models, provides additional functionality and sets the foundations for the system to move from a mainly European resource towards a global solution.
One minor issue I find to be a backwards step is the loss of the facility to generate a simple HTML (/non-PDF) table giving estimates of monthly generation to act as a target to measure system performance against. Yes, it's possible to download data in a comma delimited format, create PDF format output, or simply take note of the figures by hovering over charted data, but it is a minor niggle which isn't necessary given a little forethought, but at this point I find it refreshing that this little 'niggle' is the only negative to report on, so overall, PVGIS-5 looks to be a reasonable step forward.
This entry uses examples based on Meriden, UK. This is for no reason other than representing a location which is both in the central region of England, therefore representing population density as well as being the traditional centre of England for over five centuries.
Links
( Screen Image Reproduction - Source European Commission JRC - PVGIS)

Interested in energy efficiency ? - Have a look around the Vriconian site!
Do come back regularly for updates ... We don't sell, we don't bite, and we're growing!


Comments