Home Solar Batteries: 2.1d Charging - Hourly PV Model
- Opinion
- Mar 4, 2019
- 4 min read

Introduction
This post specifically addresses the charging of domestic battery systems using solar PV and forms part of a series of entries looking to establish a reasonable view as to how the combination of solar PV and battery storage system should be modelled to ensure that information available to consumers should be considered accurate enough to establish a reasonable justification for investment in storage technologies.
If this is the first time you've accessed this information it is recommended that all of the relevant posts are considered in order through accessing the 'relevant posts' links
Hourly PV Model
In looking at this level of accuracy we're really starting to look at the generation curve within a day. Utilising information derived from averaged hourly data opens up the ability to model excess generation in a typical day within a particular month, which certainly helps to raise the level of accuracy.
Solar PV systems effectively have two typical generation profiles for a day, both of which, when charted, would create what is generally referred to as generation curves.
Firstly there is a curve which would apply to what generation would be expected to be for a typical day within the month assuming typical clear sky conditions, effectively a cloudless day with unbroken sunshine.
Obviously the frequency of almost perfect generating days depends on location, so it's probably not too controversial to establish that within the UK it's pretty rare.

In the figure above we can see an example of the estimated clear sky generation curve compared to actual generation for that day. The variability of generation shown represents would be typical for an individual day, however, applying average generation data over a long period xx
1. The Folly of Hourly Estimation using averages
As we have seen when discussing Annual, Monthly or Daily generation modelling, the basic data would be the result of averaged data. In the case of estimation tools, such as the EU JRC PVGIS-4 or PVGIS-5, the data provided results from the averaging of daily solar irradiation over many years, however, it's also extremely relevant to note that looking at historical hourly data for a particular site also involves an unacceptable level of generation averaging, ultimately leading to inaccuracy.
As previously mentioned, apportionment on a monthly basis is necessary due to the variability of generation throughout the year which increases the level of accuracy over employing annual totals, however, variability also exists from week to week, day to day, all the way through to minute by minute. This level of variation necessitates the development of model accuracy levels which cannot reliably be predicted by any form of estimation.
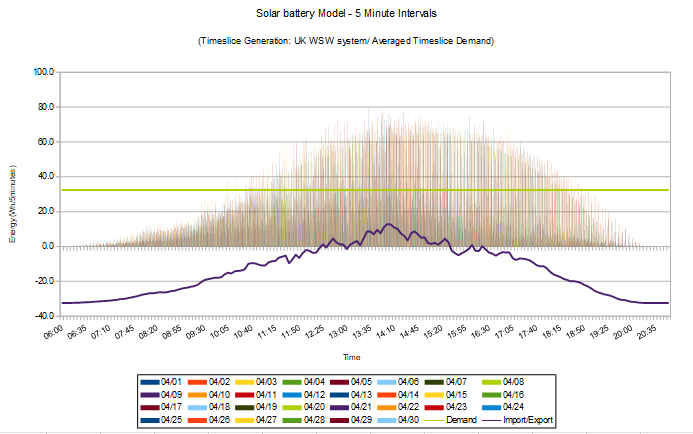
To illustrate how variability provides the illusion of stability through employing averaging we can produce an overlaid representation of a whole month of actual generation data in 5 minute intervals.

The chart above utilises a representative spring month (April), however the basic curve created by simply overlaying data would be apparent in any monthly data set, unless there were extremely atypical long-term weather (particularly cloud) conditions.
Although the result of overlaying the data effectively provides the basis for creating both the clear sky and average generation data models used by tools such as PVGIS, intra-day solar PV generation variability remains the issue at hand as can be illustrated by looking at the date in the above overlaid chart in it's basic linear form.

The above chart provides an indication of generation variability which exists between days in what
is effectively a typical month.
Energy generation data here is charted in 5 minute intervals over a 30 day period, with the overnight non-generating period (21:00 - 05:55) excluded for display purposes.
As can be deduced, any estimation of the contribution of solar PV generation towards household demand within any 5 minute period entirely depends on what the actual demand and generation would be within that particular 5 minute period as opposed to any average, whatever period that average may be derived from. Any average used would likely result in overestimation rather than underestimation of generation which could be diverted to a battery storage system, we'll address this point in detail later in the series.
Summary
Through looking at the various timescales which can be applied to modelling generation we hopefully now have an appreciation of why improving the level of detail of data can help in increasing the accuracy of any model built to estimate the self generation of energy which would be available for export or diversion to battery storage on an average basis, alongside the realisation that employing any form of averaging to any model algorithm would almost certainly lead to inaccuracy, likely in the ultimate form as overestimating any financial justification.
At this point we effectively return to a basic reality that unless we can model matched daily generation & consumption patterns with a high degree of accuracy, there would be little confidence in any model.
This is part of a series looking at domestic Batteries
Please read in conjunction with other 'Related Posts' by using the links provided
Interested in what you've just read?
Have a look around the site & keep returning, it'll grow!


Comments