
Home Solar Batteries: 2.2b Demand - Monthly & Daily Models
- Mar 12, 2019
- 4 min read

Introduction
This post specifically addresses the charging of domestic battery systems using solar PV and forms part of a series of entries looking to establish a reasonable view as to how the combination of solar PV and battery storage system should be modelled to ensure that information available to consumers should be considered accurate enough to establish a reasonable justification for investment in storage technologies.
If this is the first time you've accessed this information it is recommended that all of the relevant posts are considered in order through accessing the 'relevant posts' links
Monthly & Daily Demand Models
In the previous post in this series we looked at using data derived from annual or quarterly demand applied to apportioned annual generation data. In looking at ways to improve accuracy we'll now consider the effect of modelling monthly and/or daily demand on estimated future PV generation.
Earlier, when discussing modelling solar PV generation, it was shown that unless historical data was available for individual sites, daily model data would need to be derived directly from period data which tends to add little advantage, hence the reason for combining the two here.
1. Apportionment
Previously in the series, it was shown that when compared to generation, demand displays relatively little difference on an averaged basis whether on a daily or monthly basis and that what variation exists will be subject to reduction as energy efficient efficient appliances and devices.
Apportioning existing block data to create a derived energy modelling data set at whatever level of resolution adds little in terms of accuracy unless an arbitrary loading mechanism is employed. however, whatever this may be
2. Historical Site Data
Where accurate electricity demand data exists, whether in the form of historical data as recorded manually by the household, registered monthly into a supplier on-line portal or as a result of automated data collect via smart-metering equipment.
It is important to note that in the absence of major household changes which would impact on the pattern of energy consumption, such as changing the number of people residing in the property, the use of site specific historical data is preferable and would likely result in improved model accuracy when applied on a monthly basis.
3. The Effect of using Average Annual Demand & Monthly Demand Models
Here we will briefly look at a couple of the main options available to model household consumption relative to on-site solar PV generation on a monthly basis.
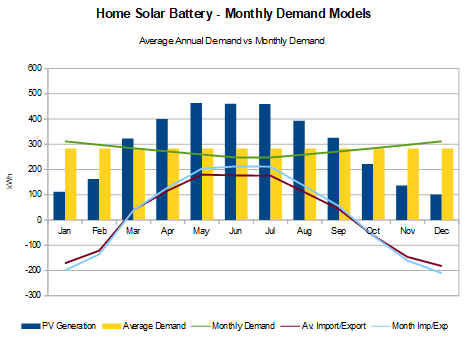
The chart above represents a UK household with average annual electricity demand & solar PV generation as calculated using the JRC PVGIS-4 estimation tool.
Against the backdrop of generation (represented by the blue bars) we have two demand options, both of which sum to the same annual energy usage total. The charted yellow bars represent annual demand derived & apportioned equally to each month from annual demand, whereas the green line provides an indication of a realistic spread of actual monthly electricity consumption, in this case the data is based in historical averages, but it could just as easily have been derived from a monthly weighting formula.
To analyse the overall effect on the solar PV generated energy calculated as being available to either export or divert to battery storage solution we've simply subtracted the two forms of monthly demand from the estimated monthly generation. The results clearly show that a simple apportionment of demand results in underestimation of energy available to storage in summer and a corresponding overestimation of the effectiveness of PV generation in the winter.
Taking the total energy differential for the two options it would be possible to assess that the use of actual monthly data would provide around a 35% model benefit, however, it's worthy to note that including negative energy as being available to store is illogical, therefore when stripping months with analysed averages below zero the assessment moves to a more logical 17%.
In addition to the above it is important to note that whether the annual difference between the two approaches is 35%, 17% or any other figure, the reality remains that the vast bulk of both the differential as well as the total energy available for diversion actually occurs within relatively few months centred on mid-summer. This creates an imbalance in energy available to divert to storage over the year which, unless the battery performance is considered as being unconstrained through specification, logically leads to any model based on monthly energy generation and consumption to describe excess to capacity solar PV generated still being exported during the summer and no, or little, energy being available to divert to storage during months with fewer daylight hours.
Summary
The above analysis highlights how erroneous logic can be applied to manipulate an assessment of energy available to battery storage when considering monthly timescales and that the inherent issues that exist when analysing using large (monthly) data time-slices do not provide the level of confidence which would be required to justify any potential benefit from the combination of battery storage & solar PV technologies.
This is part of a series looking at domestic Batteries
Please read in conjunction with other 'Related Posts' by using the links provided
Interested in what you've just read?
Have a look around the site & keep returning, it'll grow!


Comments